Cartografías
Librerías y preparación de los datos
Librerías
library(ggplot2)
library(ggspatial)
library(rgdal)
library(leaflet)
library(widgetframe)
library(cartography)
library(sf)
SHP<-readOGR('data/CLUSTER.shp')
## OGR data source with driver: ESRI Shapefile
## Source: "D:\PROJECTS\seg-spatial\spat-seg\docs\data\CLUSTER.shp", layer: "CLUSTER"
## with 253 features
## It has 9 fieldsshapeData <- spTransform(SHP, CRS("+proj=longlat +datum=WGS84 +no_defs"))Preparación de los datos
SHP$CLUSTER <- as.factor(SHP$CLUSTER)
factpal <- colorFactor(
  palette = c('#b2182b','#ef8a62','#fddbc7','#d1e5f0','#67a9cf','#2166ac'),
  levels  = c("1","2","3","4","5","6")
  )
Generación de cartografía de clusters en mapa dinámico
m <- leaflet() %>%
     setView(lng = -73.0502777778, lat = -36.8272222222, zoom = 11) %>%

  addProviderTiles(providers$CartoDB.PositronNoLabels, group = "Default") %>%
  addProviderTiles(providers$CartoDB.Positron, group="Light") %>%
  addProviderTiles(providers$Stamen.TonerLite, group = "Toner Lite") %>%
  addTiles(group = "Mapas base") %>%

  addPolygons(
    data=shapeData,
    weight=1,
    opacity=1,
    color=~factpal(CLUSTER),
    dashArray="3",
    fillOpacity = 0.7,
    group = "Cluster") %>%

  addLayersControl(
    baseGroups = c("Default","Positron Lite", "Toner Lite"),
    overlayGroups = c("Cluster"),
    options = layersControlOptions(collapsed = FALSE)
  ) %>%

  addLegend(pal = factpal, values = c("1","2","3","4","5","6"), opacity = 1)
m
Cartografías estáticas
Lectura y preparación de los datos
Las siguientes funciones solo admiten lectura de bases de datos espaciales mediante el formato que provee la librería sf
SHP_0 <- st_read('data/CLUSTER.shp')## Reading layer `CLUSTER' from data source `D:\PROJECTS\seg-spatial\spat-seg\docs\data\CLUSTER.shp' using driver `ESRI Shapefile'
## Simple feature collection with 253 features and 9 fields
## geometry type: POLYGON
## dimension: XY
## bbox: xmin: 127170.1 ymin: 5892227 xmax: 145013.3 ymax: 5937659
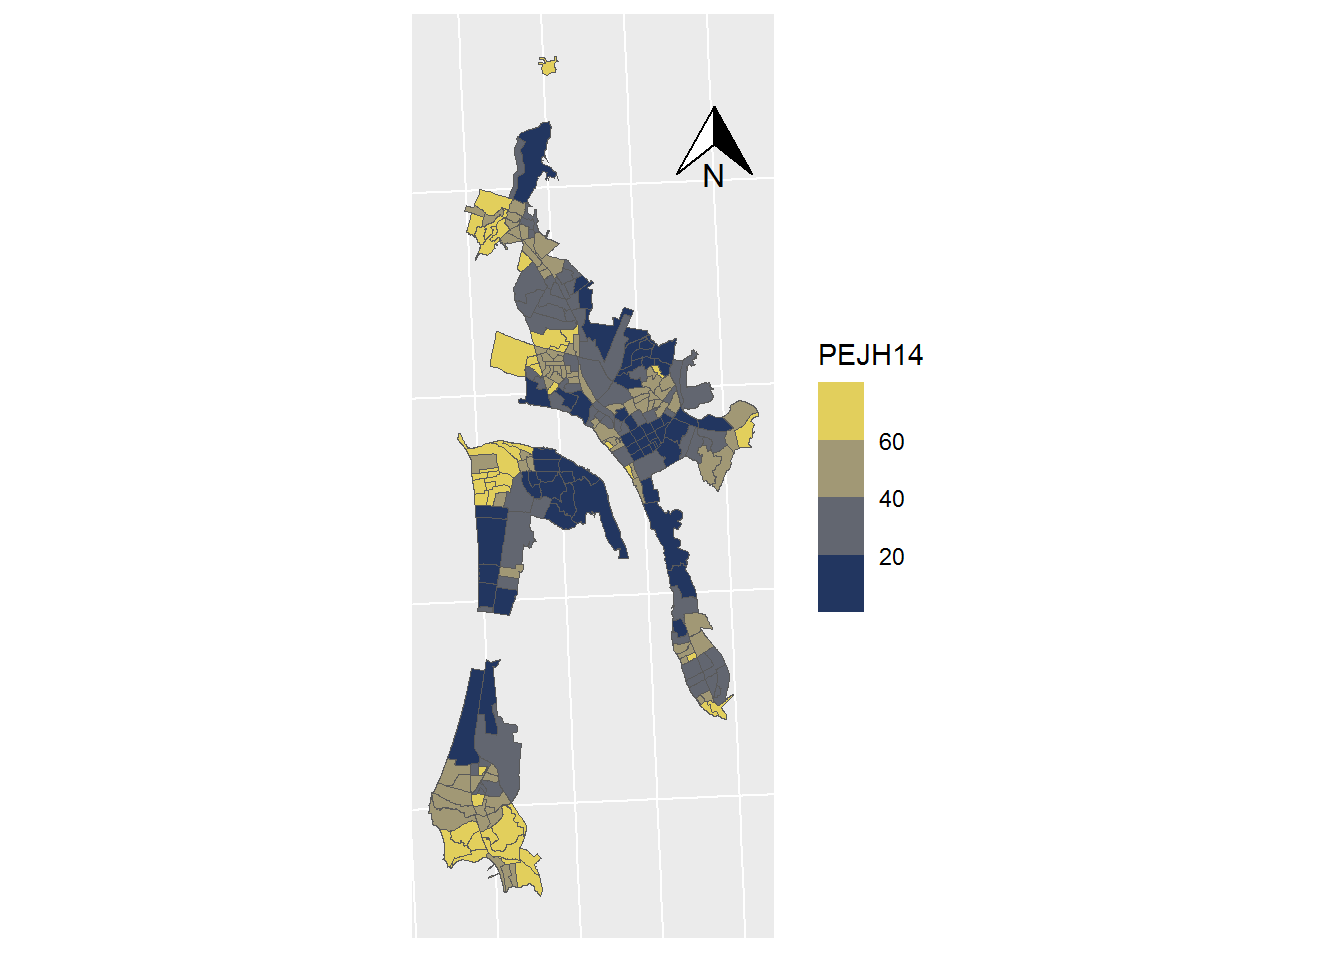
## projected CRS: WGS 84 / UTM zone 19SSHP_0$PEJH14 <- SHP_0$PEJH14*100ggplot(data = SHP_0) +
geom_sf(mapping=aes(fill = PEJH14), lwd=0) +
scale_fill_viridis_b(option = "cividis") +
coord_sf(crs = st_crs(32719)) +
theme(axis.text.x = element_blank(),
axis.text.y = element_blank(),
axis.ticks = element_blank()) +
annotation_north_arrow(
height = unit(1, "cm"),
width = unit(1, "cm"),
pad_x = unit(3.5, "cm"),
pad_y = unit(10, "cm")
)
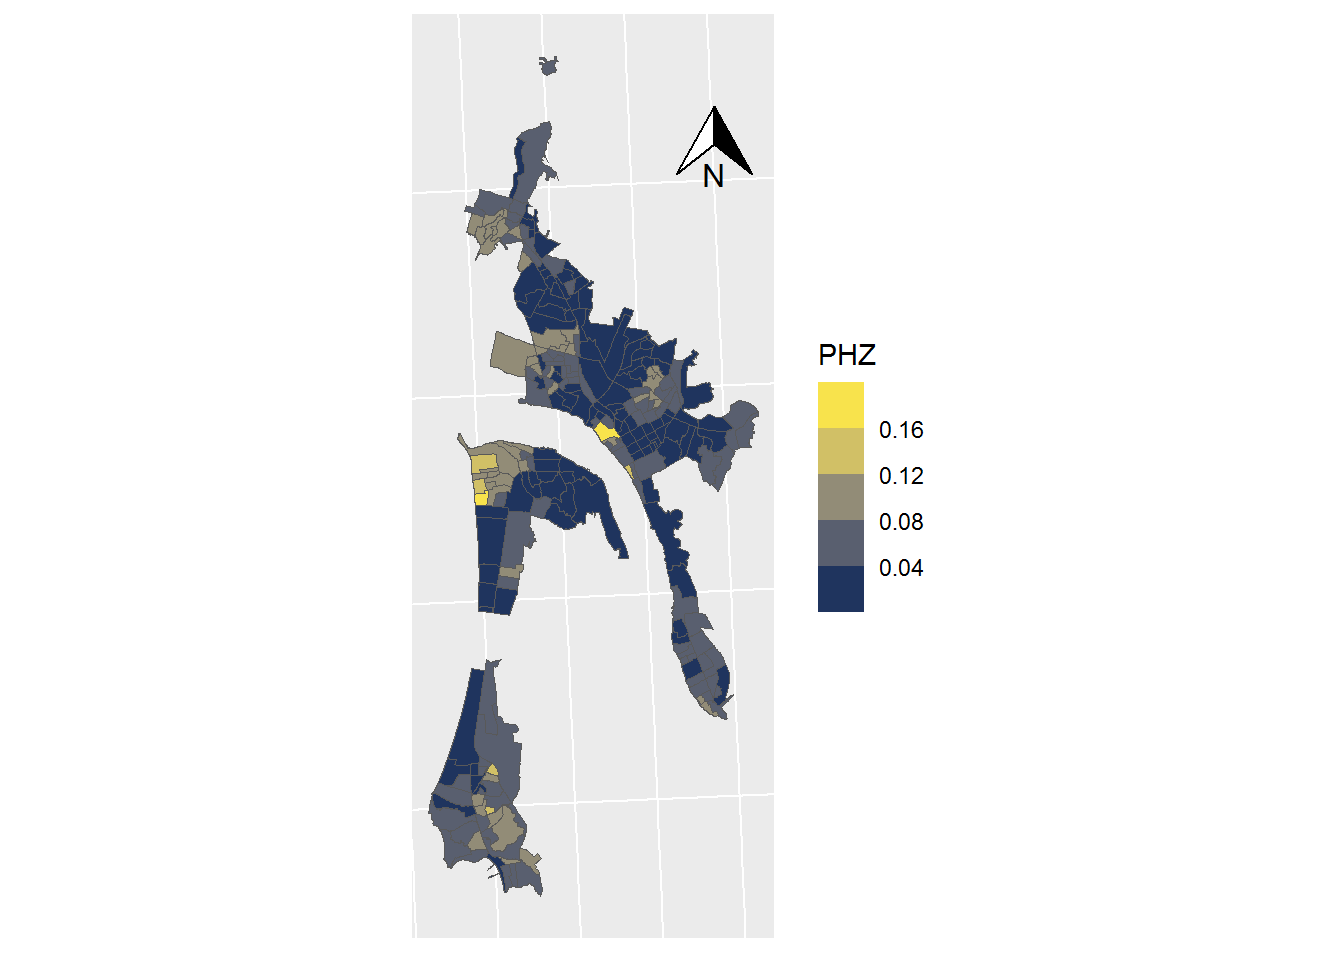
ggplot(data = SHP_0) +
  geom_sf(mapping=aes(fill = PHZ), lwd=0) +
  scale_fill_viridis_b(option = "cividis") +
  coord_sf(crs = st_crs(32719)) +
  theme(axis.text.x = element_blank(),
        axis.text.y = element_blank(),
        axis.ticks = element_blank()) +
annotation_north_arrow(
  height = unit(1, "cm"),
  width = unit(1, "cm"),
  pad_x = unit(3.5, "cm"),
  pad_y = unit(10, "cm")
  )
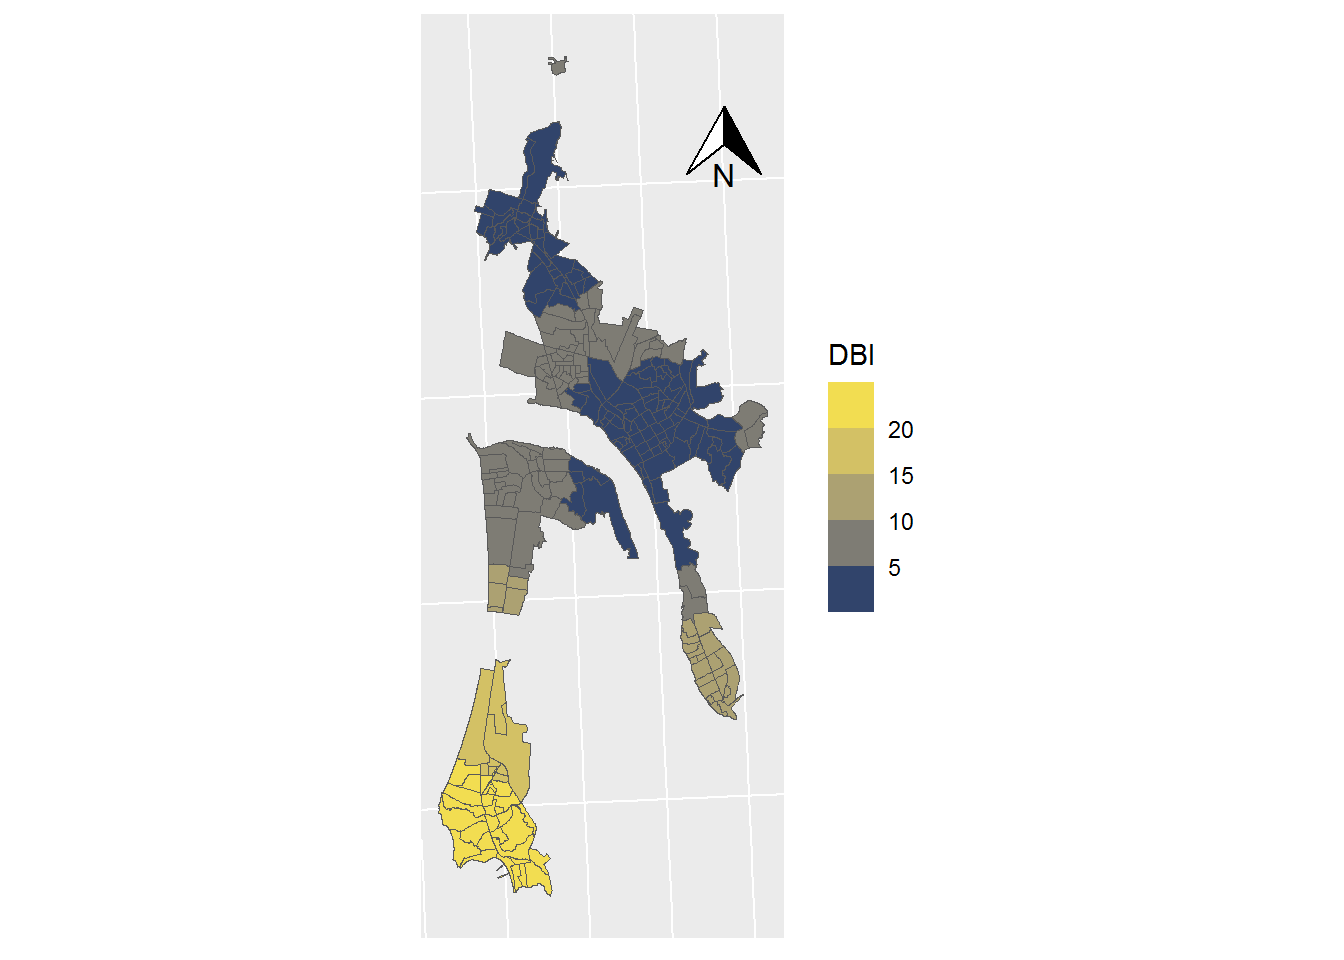
ggplot(data = SHP_0) +
  geom_sf(mapping=aes(fill = DBI), lwd=0) +
  scale_fill_viridis_b(option = "cividis",trans="sqrt") +
  coord_sf(crs = st_crs(32719)) +
  theme(axis.text.x = element_blank(),
        axis.text.y = element_blank(),
        axis.ticks = element_blank()) +
annotation_north_arrow(
  height = unit(1, "cm"),
  width = unit(1, "cm"),
  pad_x = unit(3.5, "cm"),
  pad_y = unit(10, "cm")
  )
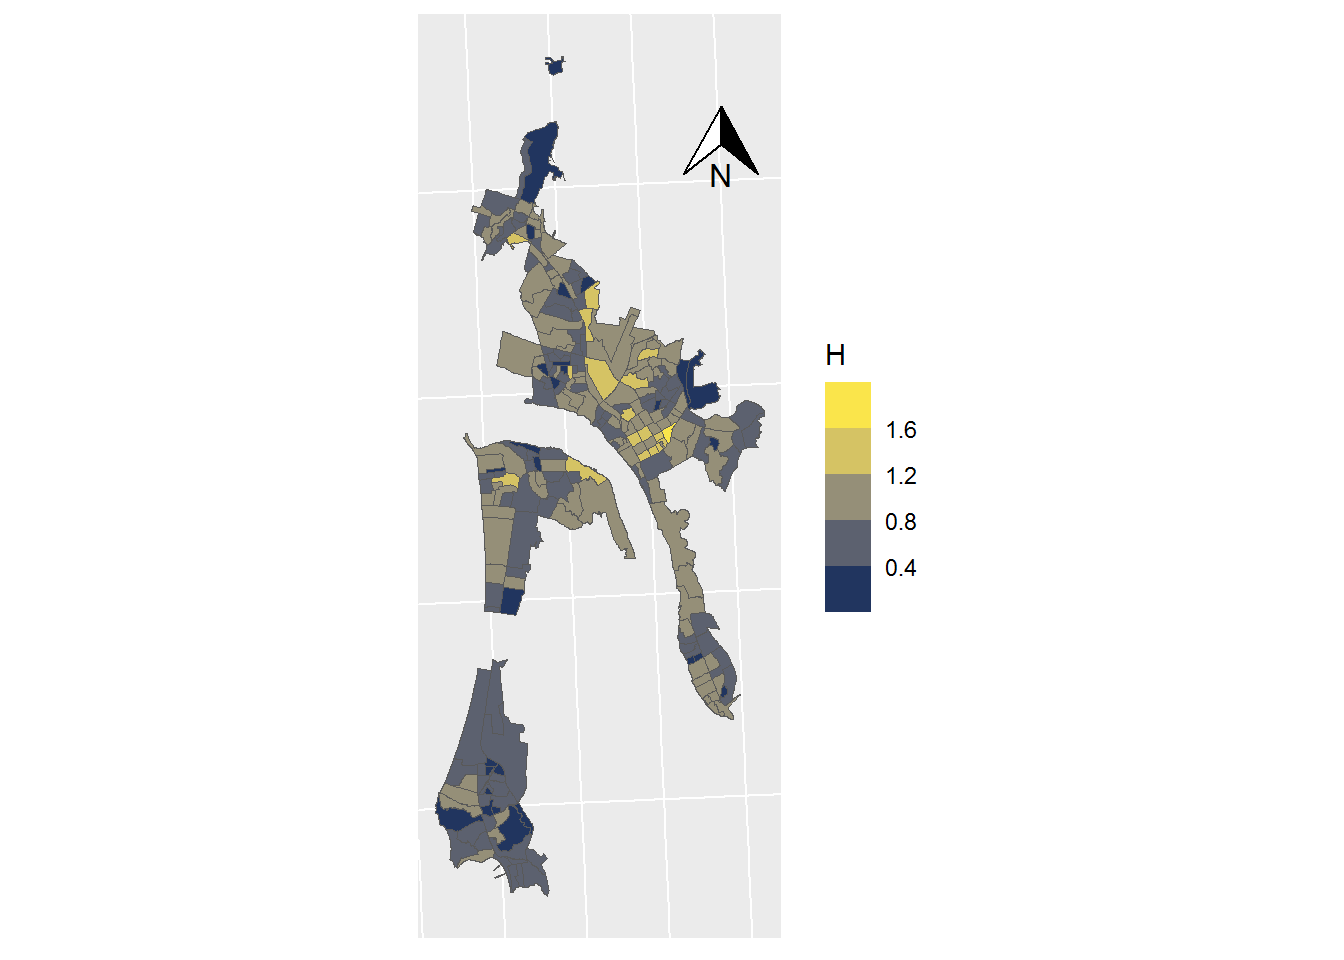
ggplot(data = SHP_0) +
  geom_sf(mapping=aes(fill = H), lwd=0) +
  scale_fill_viridis_b(option = "cividis") +
  coord_sf(crs = st_crs(32719)) +
  theme(axis.text.x = element_blank(),
        axis.text.y = element_blank(),
        axis.ticks = element_blank()) +
annotation_north_arrow(
  height = unit(1, "cm"),
  width = unit(1, "cm"),
  pad_x = unit(3.5, "cm"),
  pad_y = unit(10, "cm")
  )
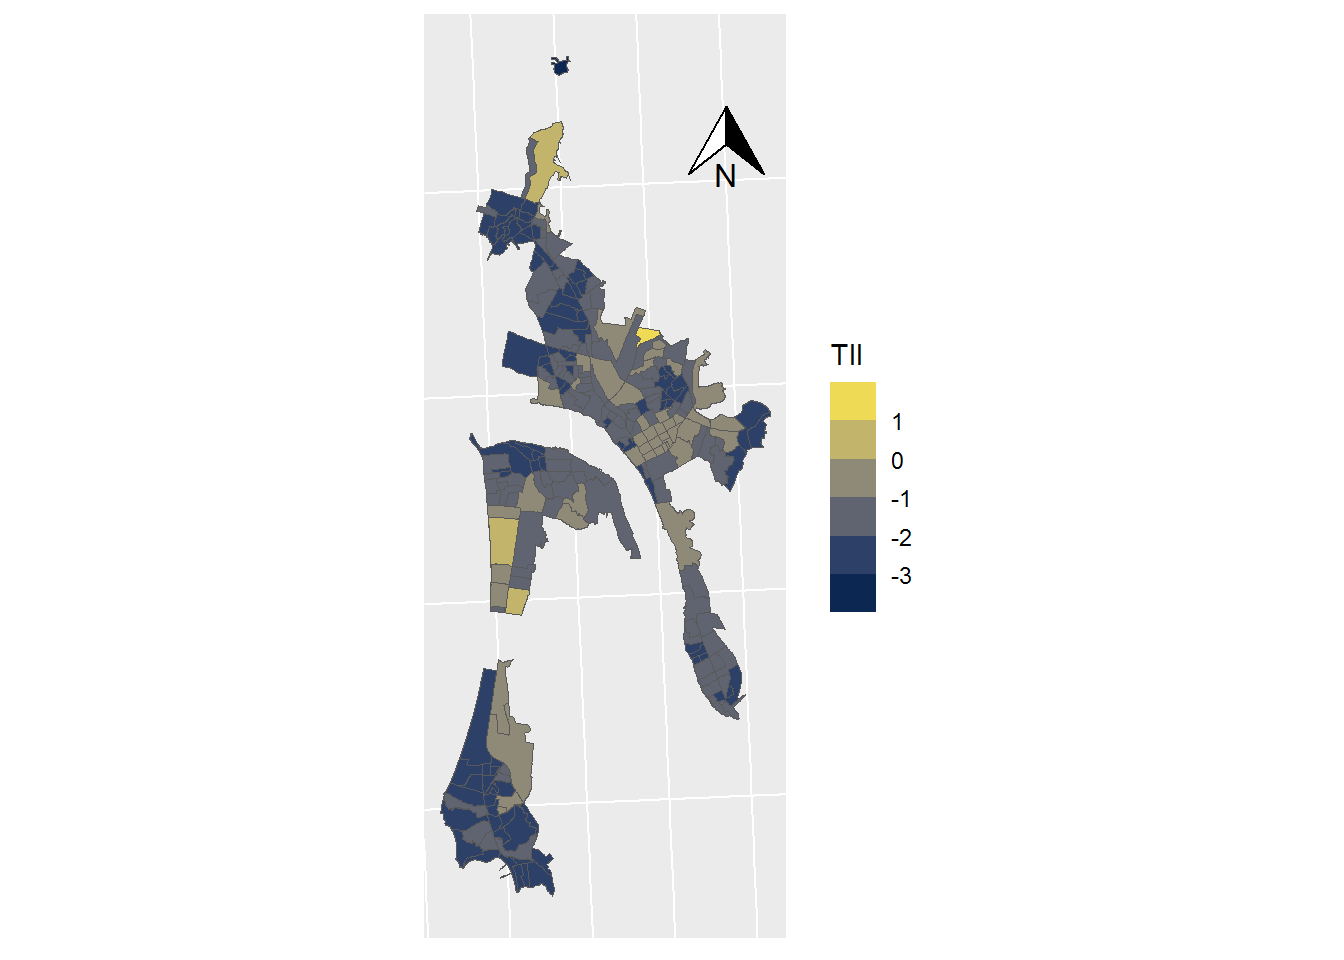
ggplot(data = SHP_0) +
  geom_sf(mapping=aes(fill = TII), lwd=0) +
  scale_fill_viridis_b(option = "cividis") +
  coord_sf(crs = st_crs(32719)) +
  theme(axis.text.x = element_blank(),
        axis.text.y = element_blank(),
        axis.ticks = element_blank()) +
annotation_north_arrow(
  height = unit(1, "cm"),
  width = unit(1, "cm"),
  pad_x = unit(3.5, "cm"),
  pad_y = unit(10, "cm")
  )
diegmedina@udec.cl